Reports for Schools
Everything else on this site is free and will stay free. This page is about the work I do with schools on their own HSC results.
The teachers who taught the students don't mark the HSC exams and never see how their students answered them, yet the exams are worth half of every student's HSC mark. My reports are built to help close that gap: to show a school what its results look like, subject by subject and student by student, so leaders and faculties can work out together what is going well and what to do next.
The reports don't make value judgements. They're there to raise good questions, and to make honest conversations about results as safe as possible.
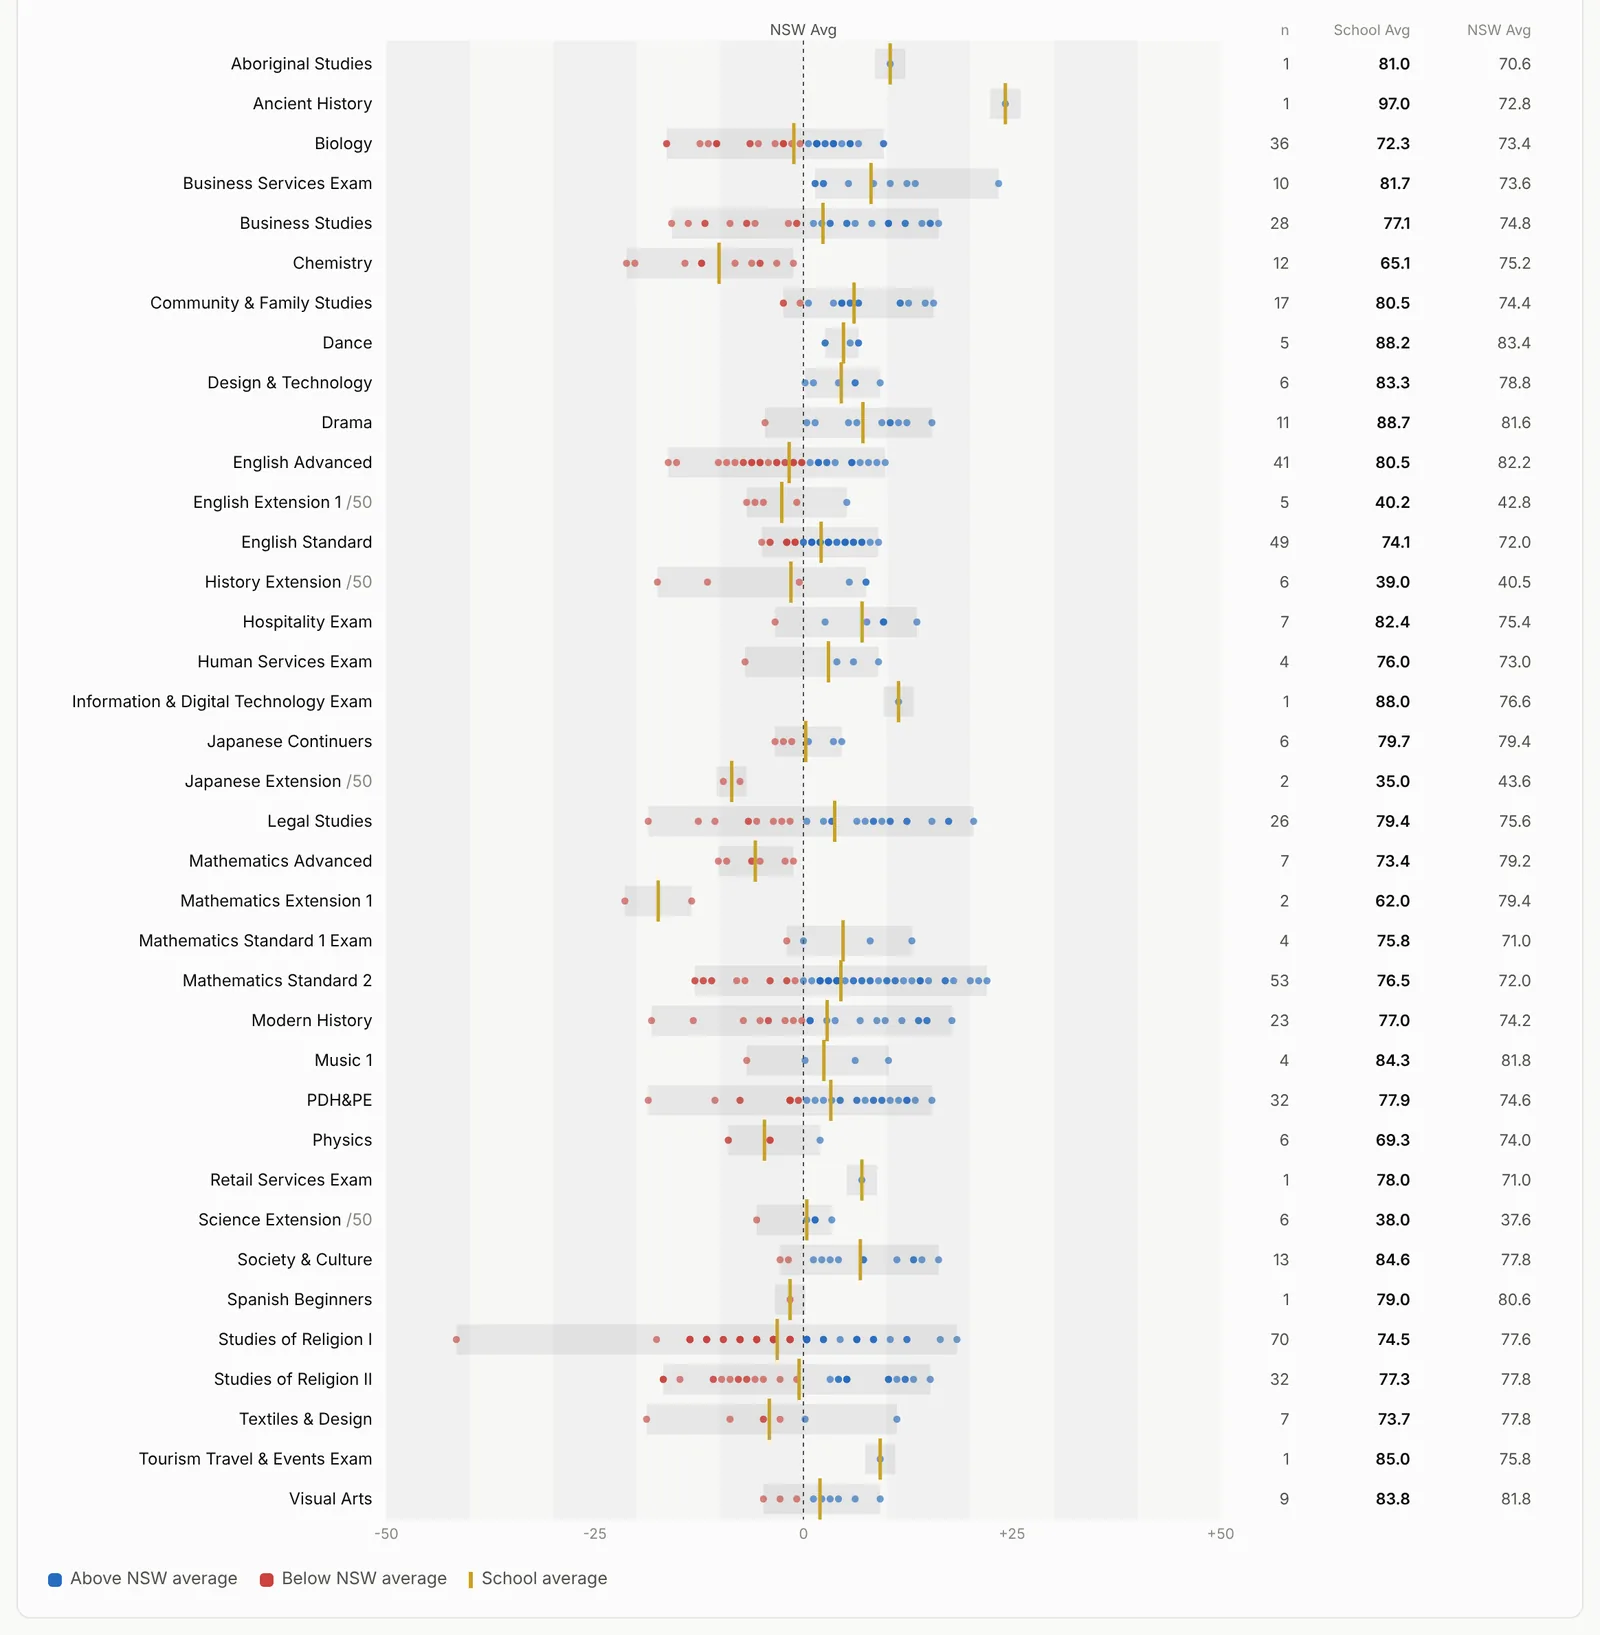
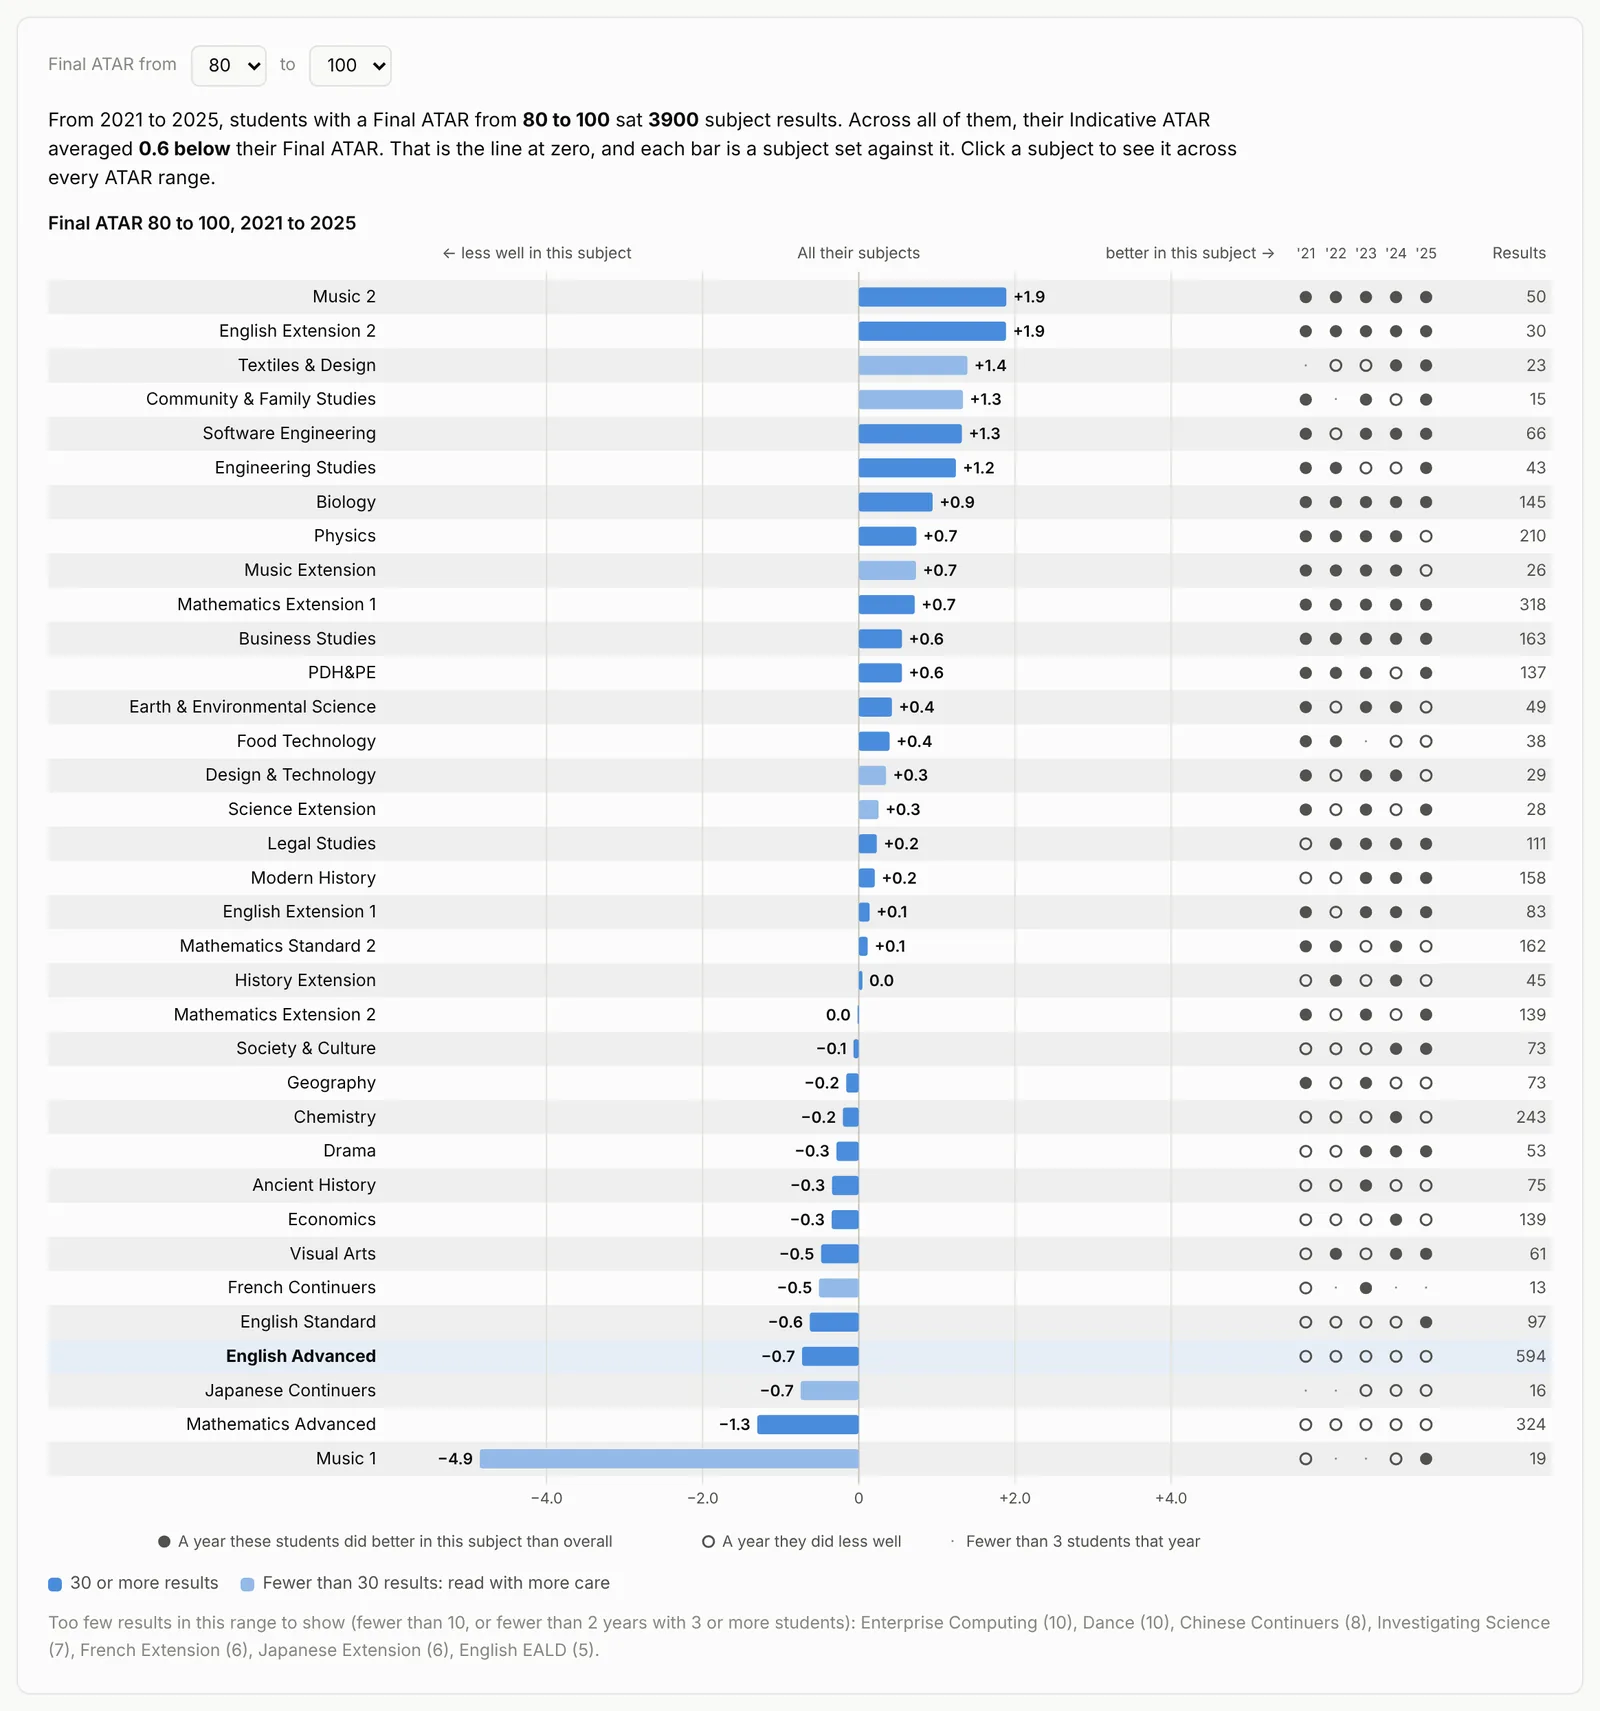
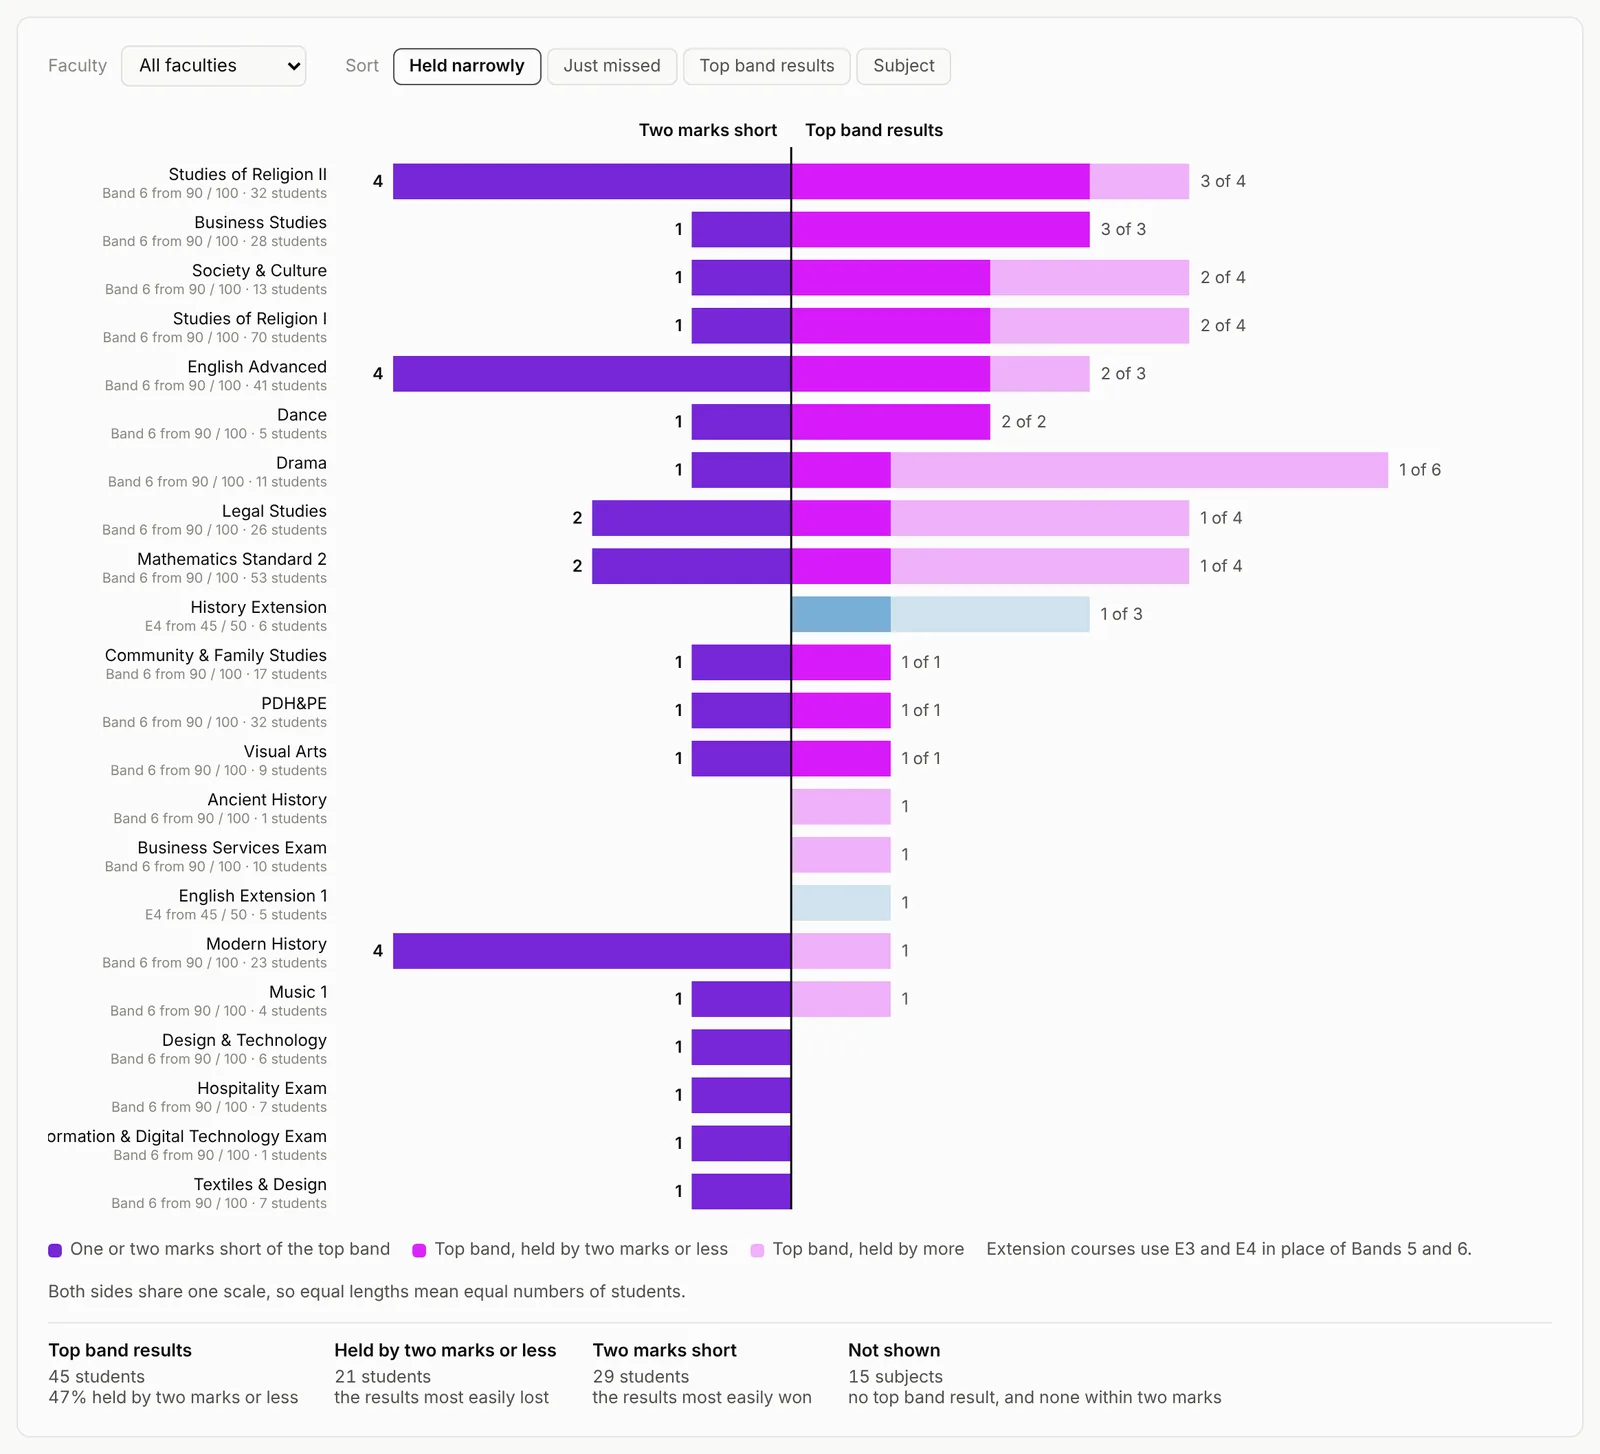
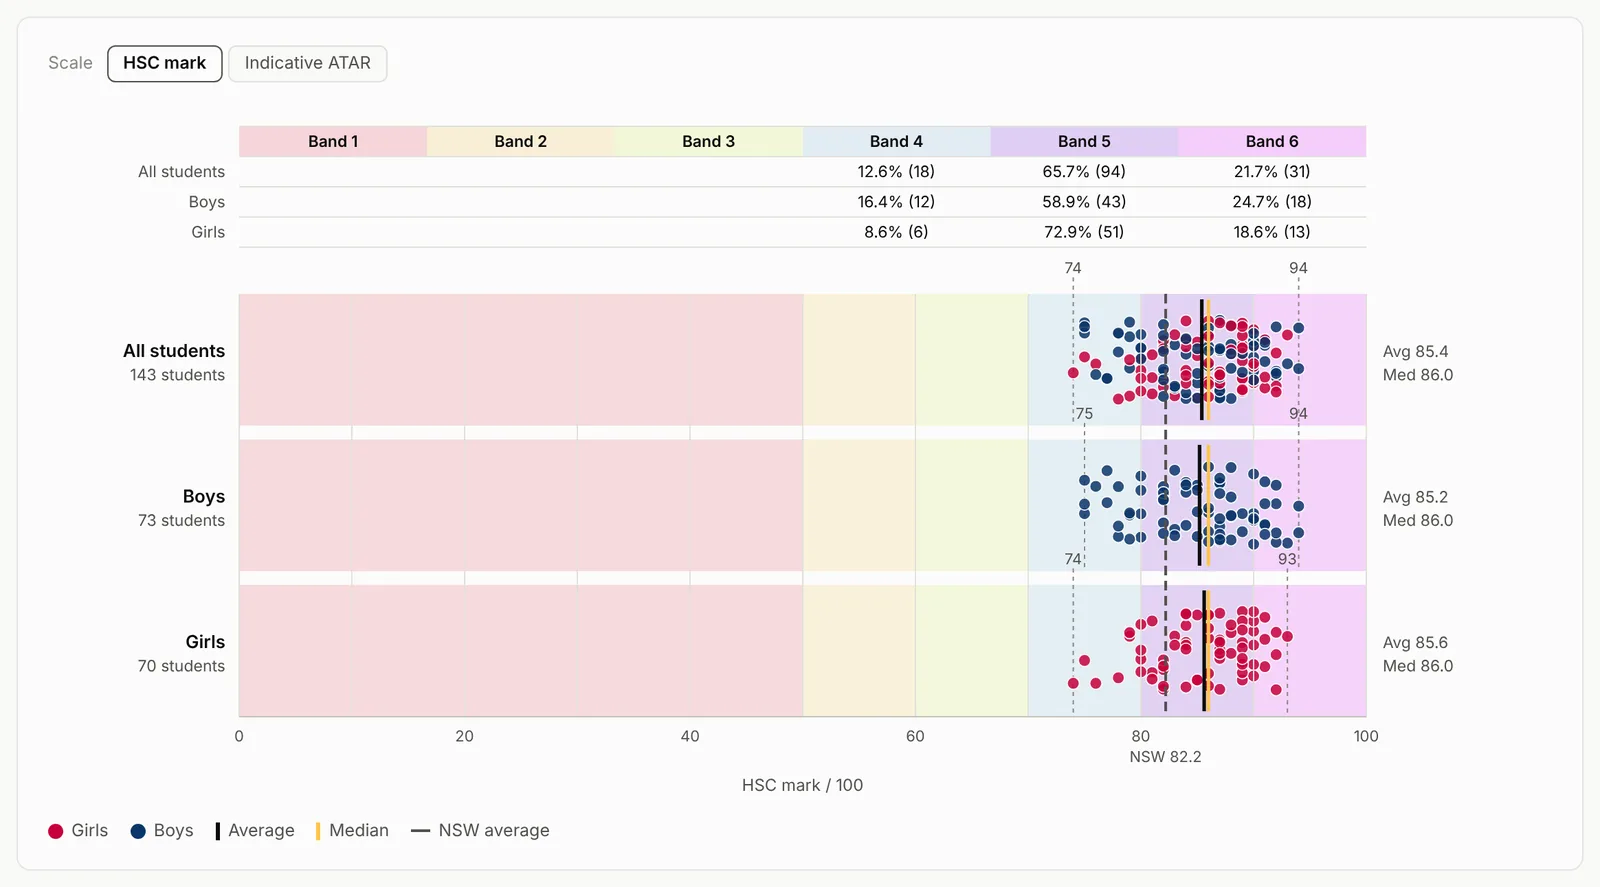
The screenshots come from two schools that don't exist: Brindle Creek High School, a small school, and Currawong Flat High School, a large school with high achievement. The students and their results are invented.
For school leaders
HSC Results Dashboard
The whole school's results in one place, organised around three questions: What are we teaching well? Who are we serving well? And, because principals get asked about it, how will we be seen? It covers bands, ATARs, how each subject served students in each ATAR range, and the last ten years of results. It includes time on Zoom with your executive team to work through it together.
For every faculty
Subject Reports
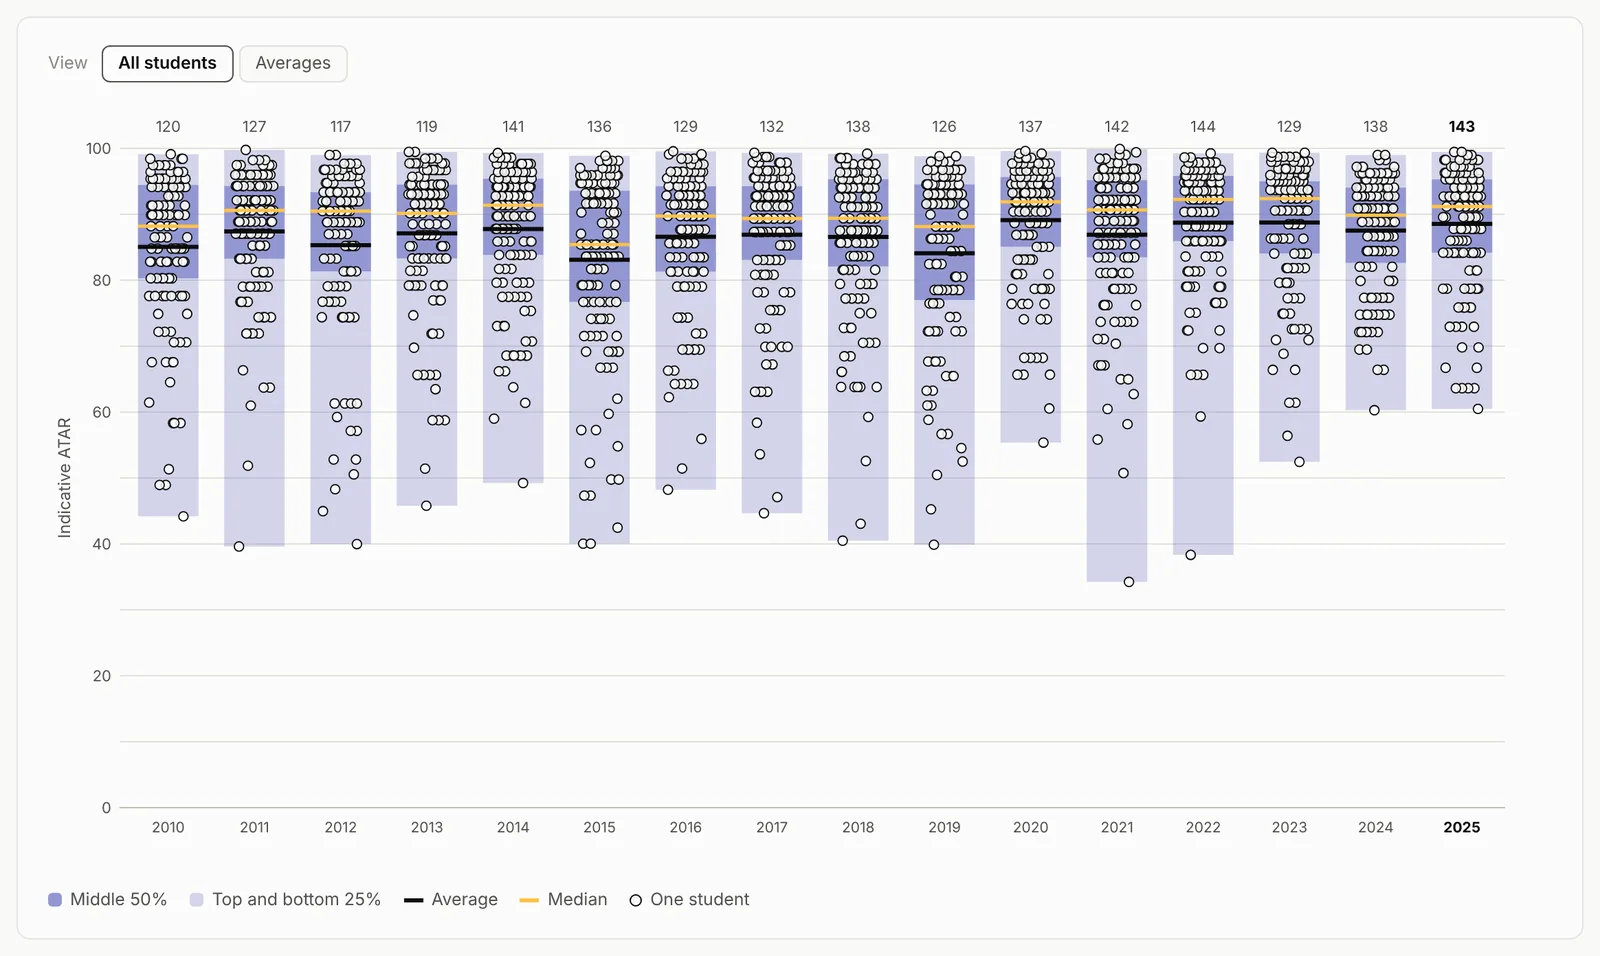
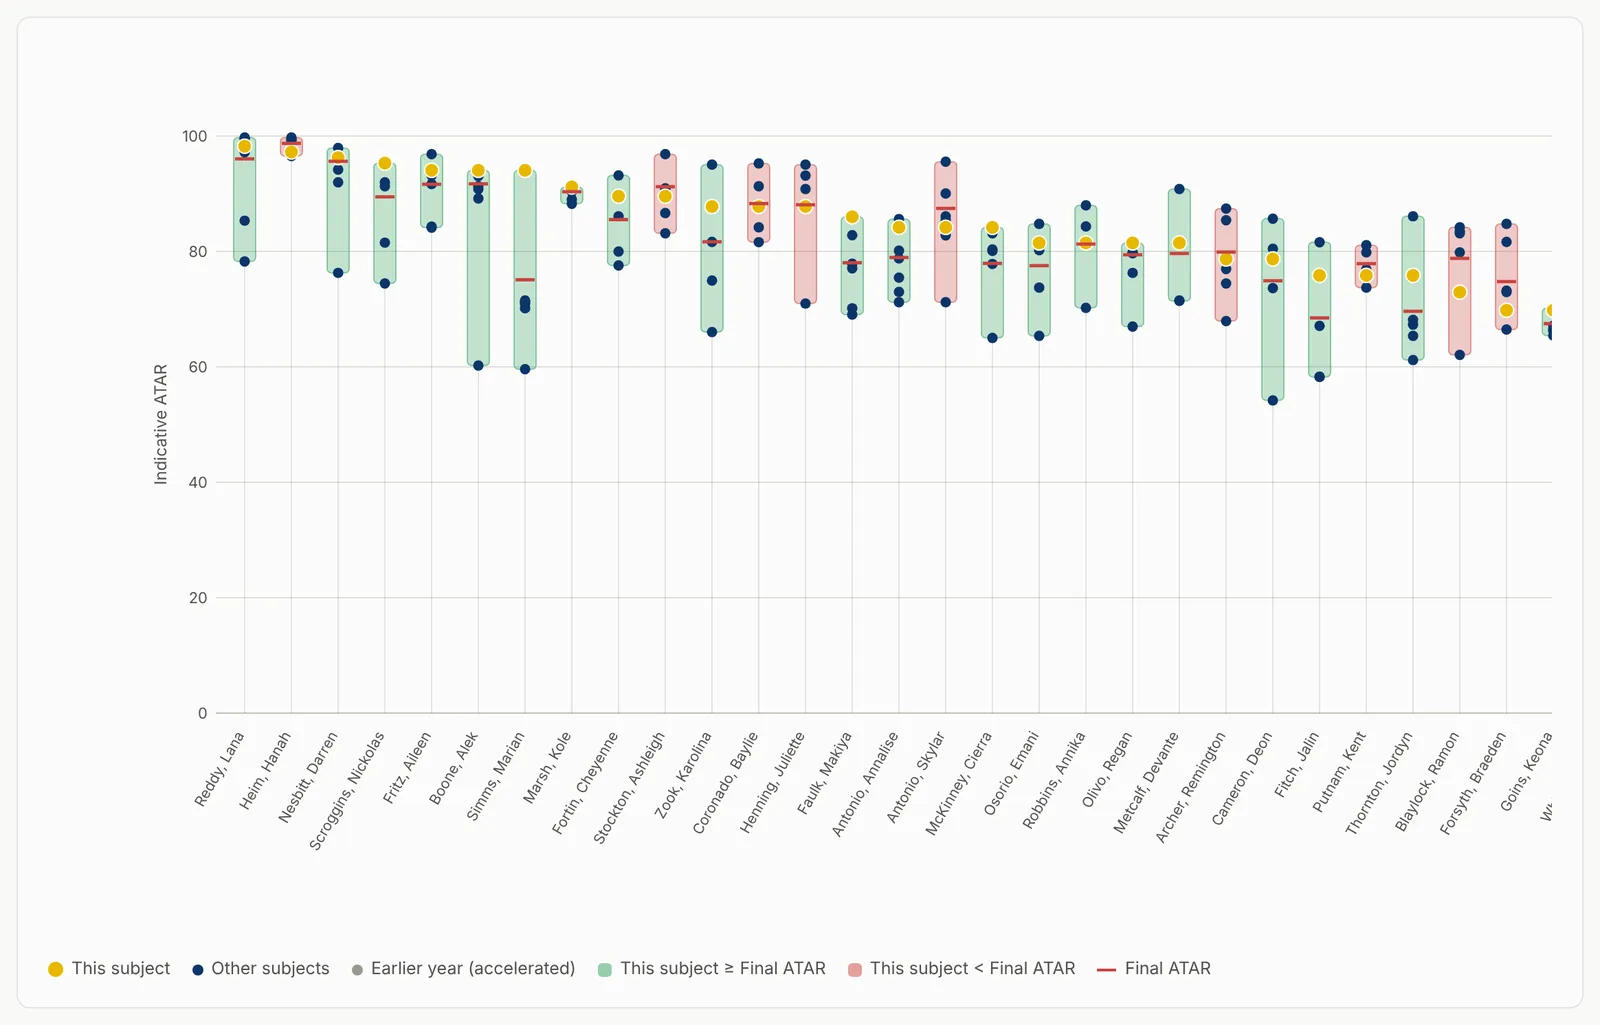
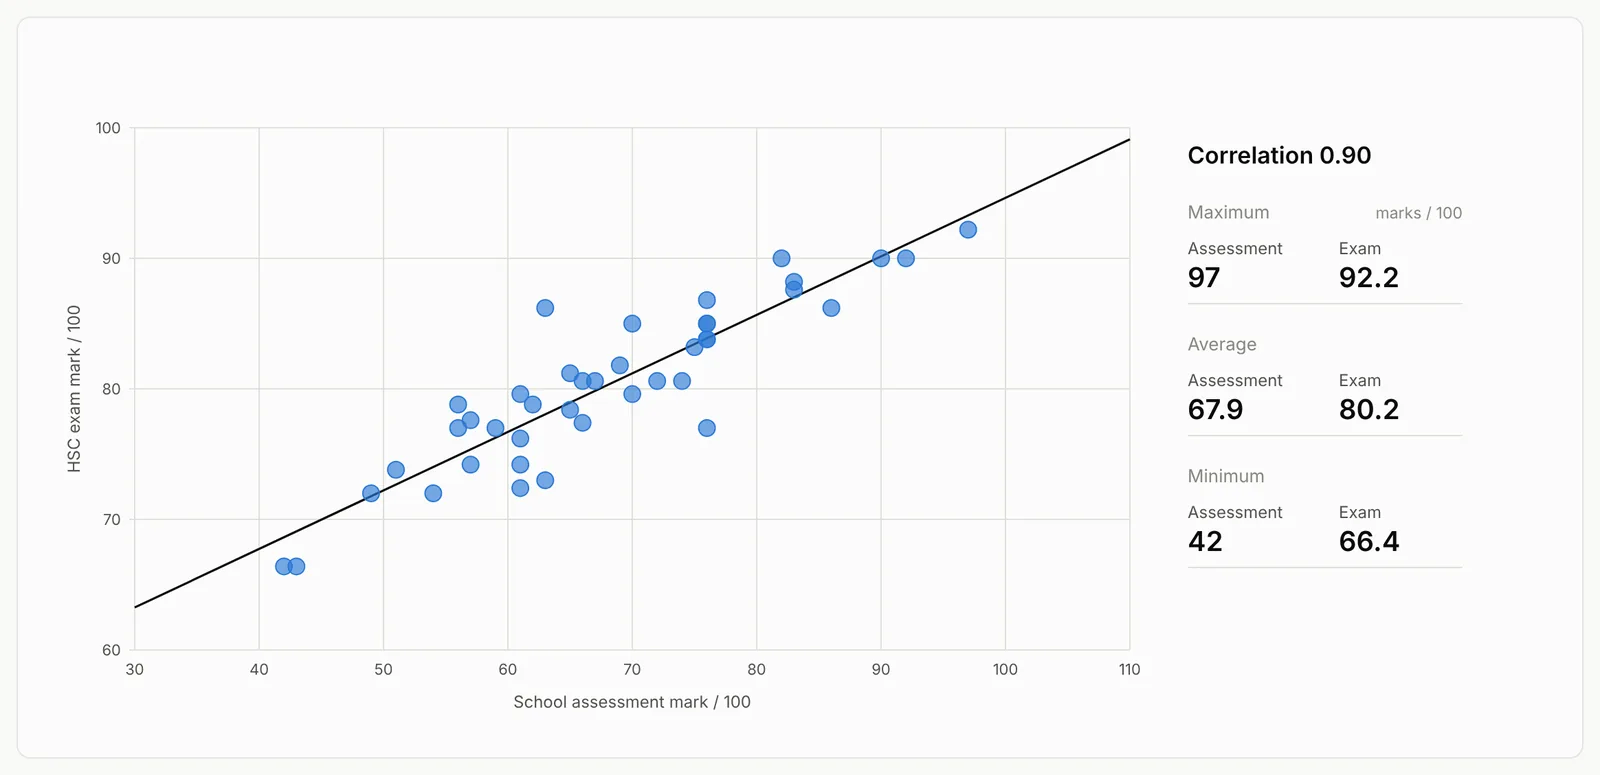
One report for every subject the school ran, so each faculty can look at its own students: achievement this year, achievement over time, each student's results across all their subjects, and school assessment against the HSC exam. A printable report and an analysis template come with each subject, so a faculty can work through the results together and write down what they'll do next.
For every faculty
Item Analysis Reports
Contact me to talk through these reports. They're my most complex offering and depend on a number of factors, so I'd love to go through it all with you.
For Year 11 and 12, during the year
ATAR Trajectories
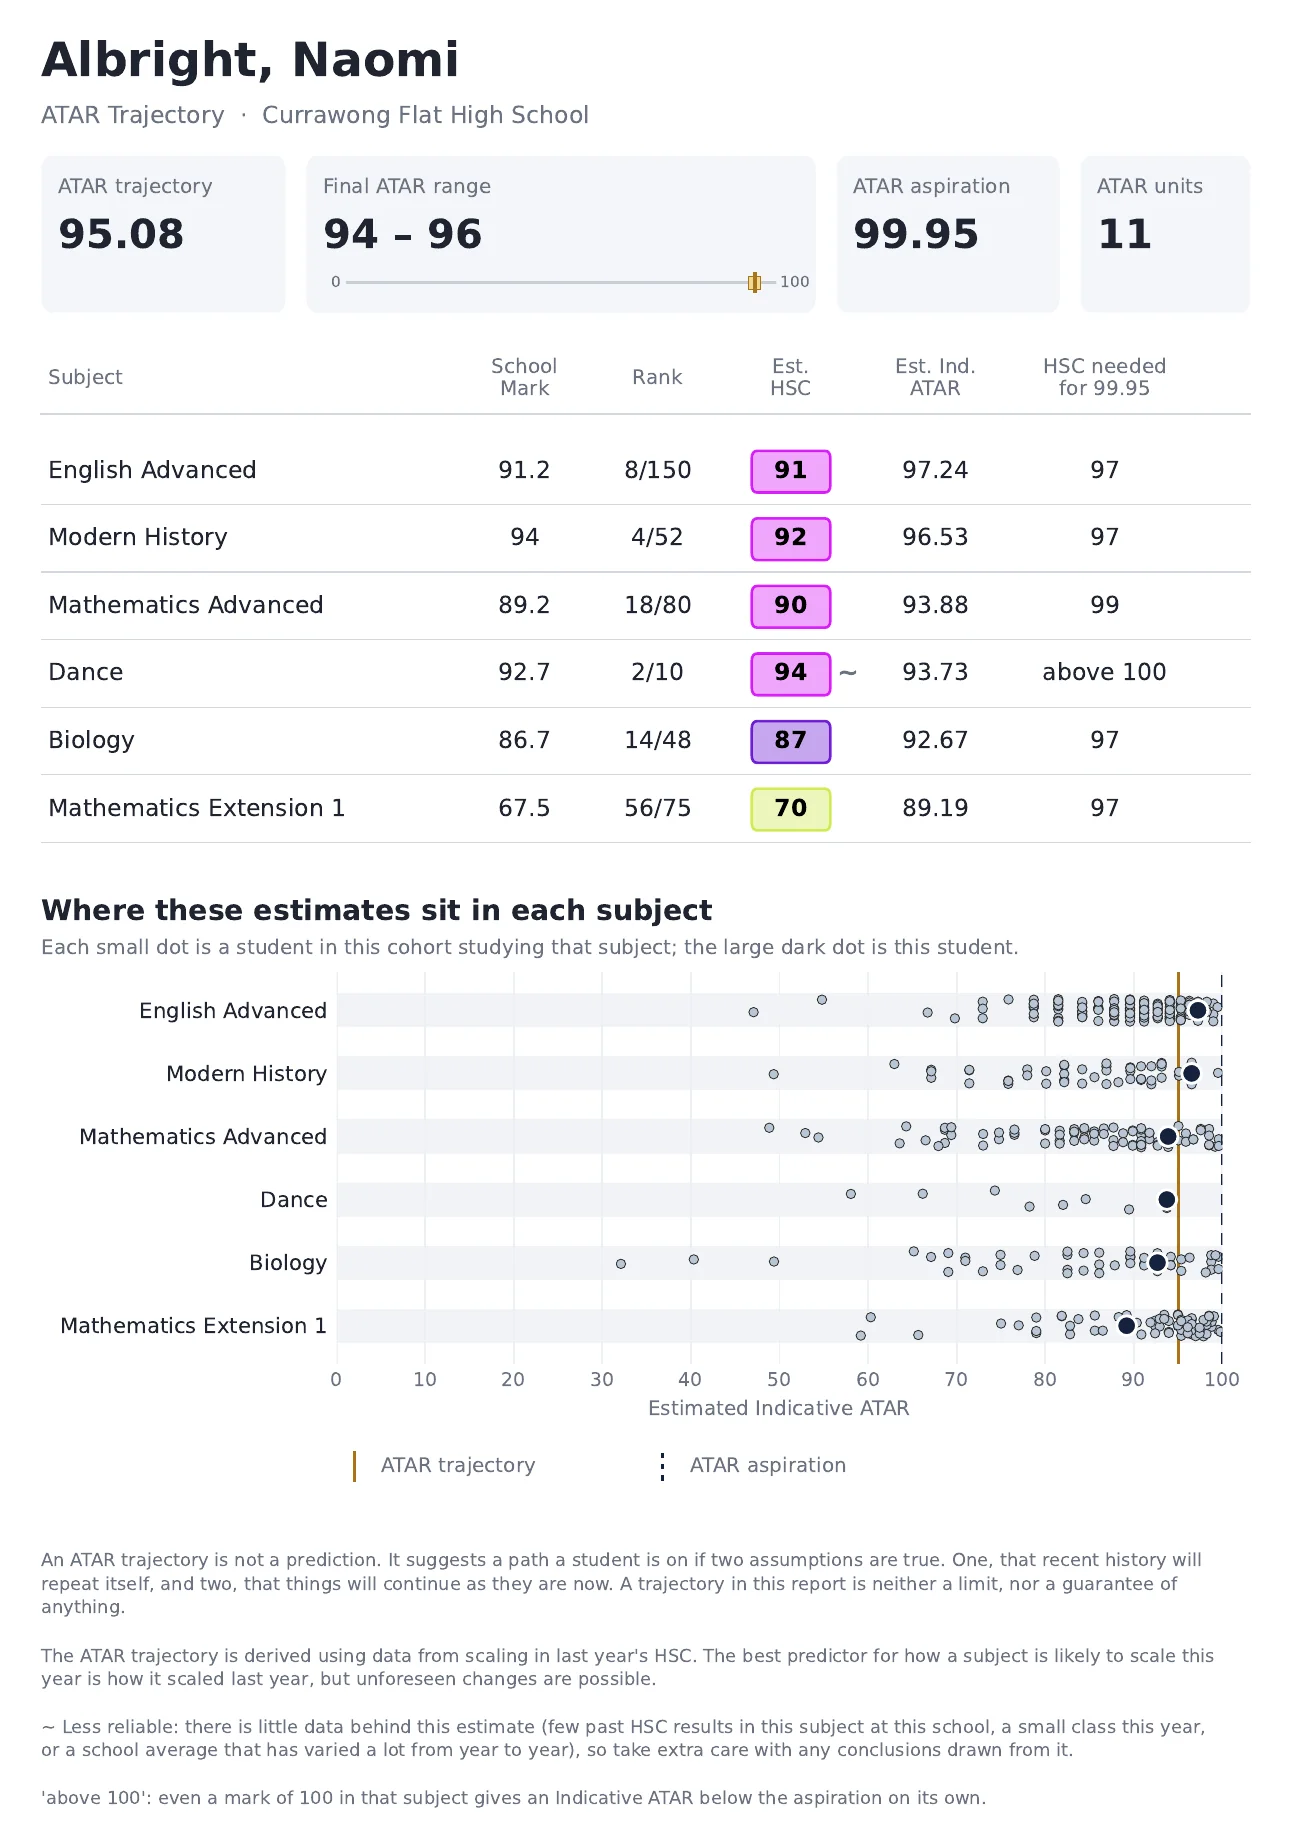
Trajectories use your school's last five years of HSC results in each subject to set what achievement usually looks like, then place your current Year 11 and 12 students' assessment results within that, to show where their results are likely to land if nothing changes. Each student gets their own report, and the school gets a dashboard to explore the whole cohort. For the one price, you can run them as often as you need during the year.
They don't suit every school. They need enough results in each subject over five years to mean something, so before you buy them I'll show you, from your own results, whether they're likely to work well for you.
February to April
School visits
A full day at your school, working with your own results and planned around what your school needs. Often that means an honest conversation with the leadership team, time with faculties one at a time to talk through their reports, and a staff meeting on how to read the reports, what the Indicative ATAR is, and the charts most worth your time. It can also include presentations on the HSC, the ATAR and scaling in your school's context, or workshops on strategic practice and goal setting. We'll talk through what suits your school.
Prices
Every school pays the same price and gets the same thing, whoever you are.
| HSC Results Dashboard and Subject Reports | $2,200 | The school dashboard, a report for every subject, printable reports and analysis templates for each faculty, and time on Zoom with your executive team. |
|---|---|---|
| Item Analysis Reports | $5,000 | With the HSC reports: $7,200 for both. |
| ATAR Trajectories | $3,000 | I'll check with you first whether they suit your school. |
| School visit | $3,000 | A full day at your school, planned with you. |
Prices are per school, per year, and exclude GST. The HSC reports are the base for everything else, so the Item Analysis Reports, ATAR Trajectories and school visits go with them rather than on their own.
This term: your 2025 results, free
This term I'm building any school's reports on its 2025 results, free. It gets everything set up for the 2026 results, so on 16 December all you do is add the new results. If they're not for you, that's fine.
How a year works
- Term 4Get ready. I send instructions to get your results files ready, and teachers write down what they expect before the results arrive. The free Term 4 page is there for that.
- 16 DecemberResults day. Your reports are built as soon as the new results are out, so they're ready before the school year ends.
- Term 1Analyse. Leaders and faculties work through the reports. This is when I visit schools and run online meetings to walk teams through them.
- During the yearLook ahead. ATAR Trajectories for current Year 11 and 12, for schools that use them. For the one price, you can run them as often as you need throughout the year.
Your students' data
Your students' results don't need to leave your school. Each school gets its own dashboard file, which runs offline on your own computer. You download your results from NESA's RAP, drop the files in, and it builds your reports. I give you step-by-step instructions, and I'm on hand if you get stuck. It's also the fastest way to get your reports: you'll have them on results day, without waiting for me.
If you'd rather I build them for you, we can talk through that process and what will work for your circumstances.

I'm Graham. I help schools analyse student achievement data, especially in and around the HSC. I've taught in NSW schools for 15 years, and I love giving schools and teachers resources to see and analyse their students' achievement.
Have a look at your own results
The best way to see what these reports offer is with your own school's results in front of you. Book a time with me on Zoom and I'll walk you through them, or call or email me with any questions.